Pretty much everything we do in our daily life falls under a project type. In fact, Life sometimes just feels like one giant project whether it’s the epic To Do List that just keeps growing or planning a vacation like one that even a travel agent would be like stressed out about. So, it doesn’t really matter if you’re just like organizing a potluck or, on the other end of the spectrum overseeing the construction of a skyscraper. The fundamentals of project management stay the same and one tool that has been helping people manage their projects really well is the Gantt Chart in Microsoft Project.
Gantt Chart in Microsoft Project
Chances are, you’ve seen Gantt Charts without even realizing it. These visual timelines are a go-to tool in offices for keeping work projects on track, but they’re just as handy for personal tasks—like booking accommodations, scheduling your workout activities and more. At its core, a Gantt Chart maps out the sequence of tasks needed to complete a project. So, imagine a horizontal axis that represents time. Then, you have these bars, and each bar represents a specific task. The length of the bar corresponds to how long that task is going to take. So, whether your project spans two days or ten months, a Gantt Chart keeps it organized and on track.
What makes Gantt Charts in Microsoft Project so powerful is that they illustrate dependencies between tasks as some tasks just can’t be started until others are finished. So, you can actually link these bars together and visually demonstrate those relationships. For example, if you’re planning a website launch, you wouldn’t want to start marketing the site until it’s actually built in or functional.
When put on the Gantt chart, you would see the website development taskbar and then the marketing campaign would start after the development bar ends. That way, everybody knows what the order of operations is.
Keeping the above points in mind, some terminologies for Gantt chart in Microsoft Project you should be aware of.
Key components of Gantt Chart in Microsoft Project
- Milestones: Milestones are key markers in your project, representing significant points of achievement. It could be like you’ve completed a really critical phase of the project or a major deliverable is done or you’ve hit a crucial deadline. Think of them as the big bold checkpoints to keep your project on course.
- Timeline: Placed horizontally, timeline shows the project’s timeframe, usually broken down by days, weeks, or months.
- Dependencies: Basically, it’s the relationships between tasks that are shown by linking the bars together. Dependencies llustrate which tasks need to be finished before others can start.
- Resource Allocation: One of the great things about Gant Charts is that they show you who’s responsible for which task. This brings clarity and transparency in the type of work assigned.
Now that we understand the key components, let’s explore how to create one in Microsoft Project
How to create a Gantt Chart in Microsoft Project?
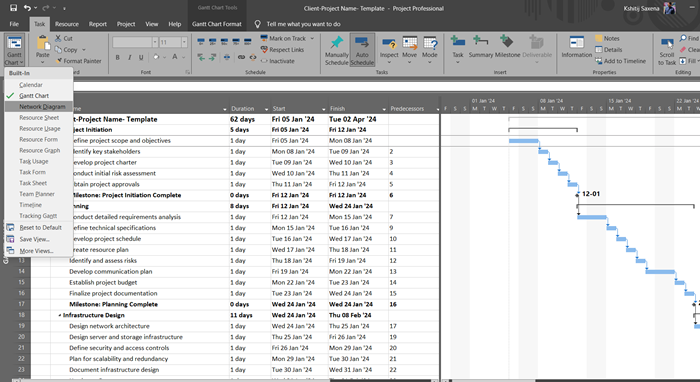
All right, so after you open the application, click on the File tab. Here, you’re going to see a variety of project templates.
These are prebuilt structures for different types of projects. So you might find templates for construction projects, software development, event planning, all sorts of.

Choose a template that aligns with your needs. This gives you a head start rather than building everything from scratch.

Once you’ve selected a template you’ll want to familiarize yourself with the Gantt Chart View. This is where the magic happens. All your tasks are laid out visually, displaying task names, start and finish dates, dependencies and resources. You get to see all the info in the form of a unique horizontal bar representation.

If needed, you can customize these charts by adding columns for things like task priority, percent. Simply use the dropdown menu to pick your option.
For example, we’ve added a “% Complete” column to monitor task progress, which can be updated by the project manager based on task owner feedback.

You can apply Colors to make the chart more visually appealing. Similarly, you can use Conditional Formatting to add visual cues to your chart based on specific criteria. Say, you might want tasks that are behind schedule to automatically turn red and tasks that are about to be completed to turn green.

That way, you can build a visual alert system that draws your attention to potential problems or areas that need immediate action.
So far, things look good but there’s one more piece of the puzzle we haven’t talked about and that’s Reporting. It’s crucial for communicating project status to stakeholders for making decisions and that’s where Microsoft Project shines.
It offers a suite of built in reports, but you can also create custom reports that are just tailored to your needs.

For instance, there’s this milestone report that appears as a great way to get a high-level overview of upcoming milestones and check what’s the status of the tasks that need to be completed before those milestones happen? Think of it as a focused snapshot of your project ‘s critical path highlighting key deliverables in the timeline. To access reports, click on the Report tab and navigate to the Milestone report.

Do Gantt Charts truly fit the needs of every IT professional, or are they better suited for specific projects?
It’s worth pausing for a second here and addressing this question. To be honest, this sort of approach brings a level of clarity and organization to what can often be a chaotic process. Whether you’re leading a team at work, pursuing a personal passion, or just trying to get a handle on that daily To Do List. These principles can help you stay focused, organized and in control.
Project management isn’t just about spreadsheets and software; it’s a mindset for tackling challenges and achieving goals. It could be super helpful for someone dealing with multiple people and trying to coordinate everyone ‘s preferences schedules.
Are Gantt Charts reliable?
There’s a misconception about these newer, more agile methodologies that they are somehow replacing traditional project management techniques like Gantt Charts. In reality, they are complimenting the tool. How? They still provide a valuable way to visualize timelines and dependencies, especially for projects with a clear start and end.
Agile methodologies like Scrum are fantastic for projects that are iterative and involve a high degree of uncertainty and change. But for projects that have a more linear structure, Microsoft Project Plan’s Gantt Charts continues to remain an invaluable tool.
We’re already starting to see the emergence of hybrid methodologies that blend traditional and agile approaches. And I think that trend is only going to accelerate as we move towards a future where projects become increasingly more complex and interconnected.
Thus, it’s not about throwing out the old for the new but rather finding ways to integrate the best of what’s come before with the most innovative approaches of today.
Closing thought
We’ve talked a lot about the tools and techniques of project management, but ultimately it all boils down to people, right? Like it’s about communication, collaboration, shared goals. Here’s the food for thought: Even the most sophisticated software in the world is not going to get you very far if you don’t have a team, that’s motivated, aligned and working together effectively.